In our previous post, we talked about how to enable the Amazon S3 server log. In this post, we will show you some of the cool MSP360 Explorer features that allow you to view the Amazon S3 server log in a human-readable form.
How to Generate a Report
To generate a report simply right-click the bucket and choose View Server Access Log from the context menu. This option will be available if you have enabled the log for the bucket previously. You can click to the Logging Setting to enable the server log.
What Reports are Available
Reports are available in a tabular form and a chart form. Reports are not available instantly. When log files are loaded and a report is generated you will experience a delay that depends on the volume of your log files and see progress.
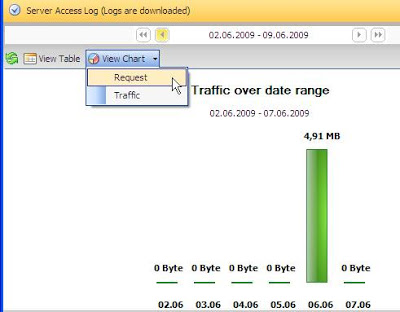
There are two charts available:
1.the total number of requests per day
2.the total traffic per day (shown on the screen)

Conclusion
MSP360 Explorer provides you only with basic means with several built-in reports for analyzing your S3 server log. If you want to have more advanced and more flexible log analysis I suggest that you look for other tools such as SiSense Prism Viewer with Amazon S3 Dashboard.
You can also check out an online service called S3Stat that generate reports from your log files using Webalizer and delivers them to your S3 bucket. These guys have also recently added CloudFront log support. Check out their latest blog post on the subject Code on the Road: Cloudfront Analytics from S3stat


